Buying a private property in District 3
- datascienceinvestor

- Jan 21, 2020
- 5 min read
Updated: May 17, 2020

(Photo credit: Wikipedia)
Date of Analysis: 14 January 2020
Period of data: Jan 2017 to Jan 2020
Number of transactions analyzed: 4770
(transaction data extracted from URA website)
District 3 is one of the districts within the RCR (Rest of Central Region) of Singapore. It comprises of few neighbourhoods such as Tiong Bahru, Alexandra and Queenstown. Some of the private properties in this region are Commonwealth Towers, Highline Residences and The Anchorage etc. Recent new properties in the area are Riviere, Stirling Residences and Avenue South Residence.
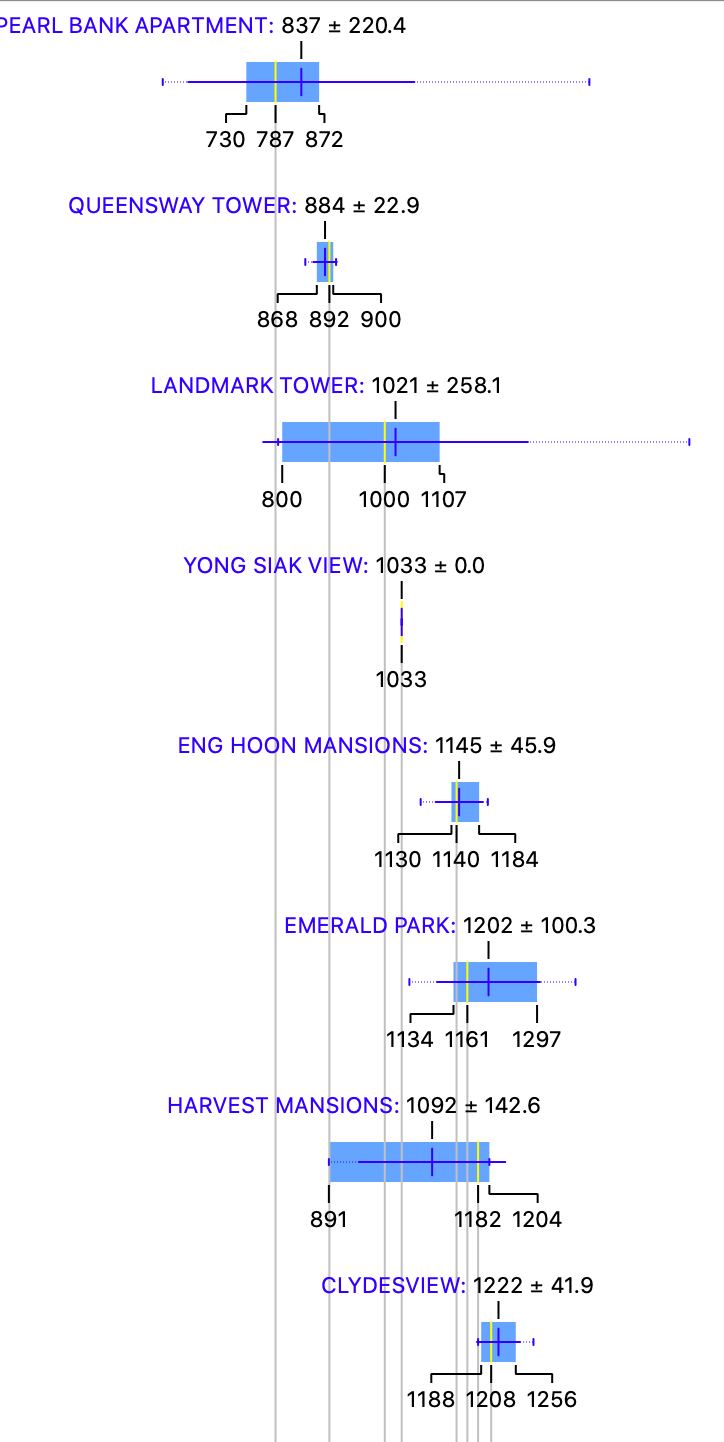
How do the private properties in D3 generally fare? Using box plots, here are the details for each of the properties in D3.

More box plots of other condominiums in this district (together with all the other districts) could be unlocked when you become a patron (https://www.patreon.com/datascienceinvestor)
To help you better understand the data, I will use Riviere as an example here. From the diagram, you can see that

Average price- $2889 psf
Median price- $2870 psf
Price at 25th percentile- $2804 psf
Price at 75th percentile- $2947 psf
I personally think that box plot is a good way to present the data. In this case, you can easily see the average price, median price, price at 25th percentile and price at 75th percentile from the plots. You could also tell at one glance how wide the spread of prices are for any of the condominium projects. Pretty neat, I will think.
The metric used here is $psf as it is a common indicator to reflect property prices.
It's also kind of interesting to note here that there aren't really many private condominium projects in D3, yet the transactions is rather high for the last 3 years with a count nearly 5000. This could perhaps point towards an indication that units in D3 moves faster than most other districts.
The most expensive condominium in D3 is Riviere with an average price of $2889 psf while the most affordable condominium in D3 is Pearl Bank Apartment with an average price of $837 psf. However, Pearl Bank Apartment is facing demolition following a successful en bloc sale by CapitaLand in February 2018. Hence, your next best option for the most affordable condominium in D3 will be Queensway Tower with an average price of $884 psf.
Now, let's take a look at the various scatter plots to have a better insight of how the property prices perform across 4770 transactions in the past 3 years.

First, a scatter plot of the $psf against date.
In scatter plot, we could derive r coefficient, which is used to explain the strength of the linear relationship between 2 variables. Since we are using $psf and date as the variables, r coefficient allows us to better understand how the $psf changes with time. To some extent, if the r coefficient is high, we could roughly assume that the $psf increases positively with time. The r coefficient (or much simply/loosely put, the gradient for the line of best fit) in the scatter plot above is 0.41. This means that the $psf in D3 is enjoying a healthy increment over the past 3 years.
From this line of best fit, you could also better understand if you are "over-paying" for your property purchase (eg. if you property is above the line of best fit). Taking a quick glance at the scatter plot, your transaction will be on the high side if you are paying more than $1900 psf in Feb 2019. Of course, there could be many factors such as location, tenure etc that could influence your buying price. This is still a general assumption.
So, which projects perform remarkably well comparatively in the past 3 years?

The plot above shows a myriad of lines of best fit from various different projects in D3.
3 of the top performing projects from the graph above are Artra, Principal Garden and The Crest. All of them are 99 year leasehold properties which are either still in construction or has just TOP in the recent years. Of which, Artra has an excellent location of being just 3 minutes away from Redhill MRT.
Next, how do freehold perform against leasehold during this 3 years period?

I have only included freehold transactions in this plot and you could see that the r coefficient of 0.35 is not too different from the r coefficient of 0.41 for the scatter plot with all transactions. This means that the freehold properties actually perform similar/slightly worse than leasehold properties in D3 and might not actually worth the premium.
Also, how about apartments of various sizes? How do they perform against each other?


All apartments of various sizes perform relatively well, with apartments of sizes below 500sqft (usually 1 bedder/studio) performing the best! This is quite similar to other districts such as D9 and D5. I start to see a certain trend of mickey mouse apartment being good investments in central/near central regions. Something worth exploring here hmm.

What you have seen above are largely data insights that we have derive using the various data science tools. But, what if we could actually use these insights to build machine learning model to attempt to predict the prices of the properties in D3 and understand if the prices the seller is asking for is reasonable? How could we do that?
We could try various different machine learning models to attempt to do so. Some examples of such machine learning models we could use are random forest and linear regression. They are methods which we could generally use to apply regression techniques to attempt to construct a linear relationship between price and various other variables (in this case, it will be project name, date of sales, size of flat etc). What we ultimately try to construct is a predictive model which allows us to have the highest confidence in prediction by attempting to reducing as much prediction errors as possible (think about Mean Absolute Error and Root Mean Squared Error)
If you are already feeling confused at this point of time, don't be as these information are highly technical in nature. You may read up more about them if you want to. Otherwise, I believe the information above in the box plots and scatter plots are more than enough for you to better understand the property prices in D3. I will also attempt to explain or illustrate more of this in a separate post in the future.
Running through all 4770 transactions through several machine learning models, I eventually achieve a model which provides me with suitable evaluation results (MAE of 93684, RMSE of 463803 and R2 of 0.998).
I then now try to put this machine learning model to practice and use it to determine what should be a reasonable price for the following property.
Project: Twin Regency
Area: 980 sqft
Floor level: High floor (assume to be 16 to 20)
Running through the machine learning model which I have created, the price I have obtained is $2,008,541 which is similar/slightly more than the asking price of $1,930,000. This might then suggest that the price listed is a fair price. But of course, more investigation will also be needed to look at other factors beyond these parameters.
Of course, the above example is just a glimpse of what is achievable as you could actually use it to determine a lot more property prices in the region. In the future, I will also consider uploading this machine learning model online so you could actually use it to determine/predict property prices based on this model. But that's a story for another day.
Now, with these data in mind, go be a data science investor!

Psst.. If you like what you read, please scroll down and subscribe for regular updates!


Comments