Buying a private property in District 26
- datascienceinvestor

- Apr 15, 2020
- 5 min read
Updated: May 17, 2020

(Photo credit: Wikipedia)
Date of Analysis: 30 March 2020
Period of data: Mar 2017 to Mar 2020
Number of transactions analyzed: 369
(transaction data extracted from URA website)
This is part of an ongoing series "Singapore Private Condominium Guide". Please refer to the link for analysis on the other districts.
District 26 is one of the prime districts within the OCR (Rest of Core Central Region) of Singapore. It comprises of few neighbourhoods such as Upper Thomson, Mandai and Yio Chu Kang. District 26 is also home to a few country clubs, with one being the Singapore Polo Club (hence the cover pic for this article).
Some of the private properties in this region are Castle Green, Seasons Park and Bullion Park etc (just to name a few). With only 369 transactions for condominiums/properties in the past 3 years, this got to be one of the few districts with a transaction count which is much lesser than average. Considering the location of the district, this is hardly surprising.
The new launches in this district of recent years are The Essence, Roots@Transit and The Brooks I & II
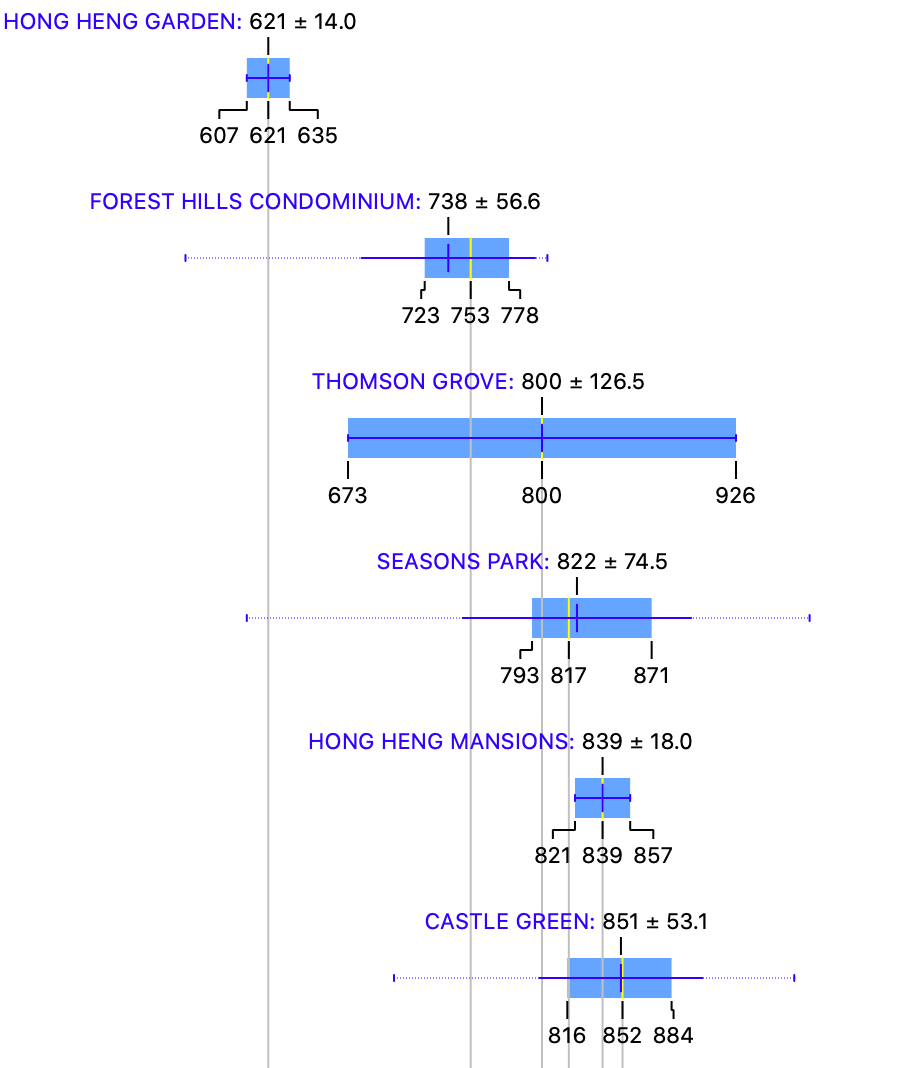
How do the private properties in D26 generally fare? Using box plots, here are the details for each of the properties in D26.

More box plots of other condominiums in this district (together with all the other districts) could be unlocked when you become a patron (https://www.patreon.com/datascienceinvestor)
To help you better understand the data, I will use The Calrose as an example here. From the diagram, you can see that

Average price- $1209 psf
Median price- $1254 psf
Price at 25th percentile- $1136 psf
Price at 75th percentile- $1337 psf
I personally think that box plot is a good way to present the data. In this case, you can easily see the average price, median price, price at 25th percentile and price at 75th percentile from the plots. You could also tell at one glance how wide the spread of prices are for any of the condominium projects. Pretty neat, I will think.
The metric used here is $psf as it is a common indicator to reflect property prices.
The most expensive condominium in D26 is The Essence with an average price of $1344 psf. This is usually the average price for many private condominiums in most of the RCR districts. The Essence is a new 99 year leasehold project which is expected to complete in 2021. Those who have bought/are considering to buy The Essence must probably have some form of private transport as it's really in the middle of nowhere with absolutely no MRT stations nearby.
The most affordable condominium (asides from apartments) in D26 is Hong Heng Gardens with an average price of $621 psf. Hong Heng Gardens is a freehold apartment completed in 1987. It has only 27 units and is also situated in the middle of nowhere like The Essence.
Now, let's take a look at the various scatter plots to have a better insight of how the property prices perform across 369 transactions in the past 3 years.

First, a scatter plot of the $psf against date.
In scatter plot, we could derive r coefficient, which is used to explain the strength of the linear relationship between 2 variables. Since we are using $psf and date as the variables, r coefficient allows us to better understand how the $psf changes with time. To some extent, if the r coefficient is high, we could roughly assume that the $psf increases positively with time. The r coefficient (or much simply/loosely put, the gradient for the line of best fit) in the scatter plot above is 0.15. This indicates that the $psf is increasing with time in the past 3 years, albeit not a huge one.
From this line of best fit, you could also better understand if you are "over-paying" for your property purchase (eg. if you property is above the line of best fit). Taking a quick glance at the scatter plot, your transaction will be on the high side if you are paying more than $1100 psf in Oct 2019. Of course, there could be many factors such as location, tenure etc that could influence your buying price. This is still a general assumption.
So, which projects perform remarkably well comparatively in the past 3 years?

The plot above shows a myriad of lines of best fit from various different projects in D26.
2 of the top performing projects from the graph above are Bullion Park and Seasons Park. Bullion Park is a freehold condominium project which TOP in 1993. As with the buyers for most of the condominiums in D26, accessibility to public transport is probably not of big concern since most of the condominiums here are in rather secluded locations. Bullion Park, for instance, is located along Lentor Loop.
Seasons Park is a 99 year leasehold apartment project which TOP in 1997. Compared to the other condominiums/apartments which I have described in this article so far, Seasons Park is relatively nearer to MRT (Yio Chu Kang MRT). Even so, it still takes you around 15 minutes by foot.
Next, how do freehold perform against leasehold during this 3 years period?

I have only included freehold transactions in this plot and you could see that the r coefficient of -0.01 is lesser than the r coefficient of 0.15 for the scatter plot with all transactions. This means that the leasehold properties in D26 perform better compared to the freehold properties in D26 in terms of $psf over the past 3 years.
Also, how about apartments of various sizes? How do they perform against each other?


You may be curious to know why is the graph for apartments with size of less than 500 sqft missing? This is because there is only one transaction for an apartment of such size in the past 3 years and hence it is not meaningful to create a graph out of it.
Out of all the other apartments of remaining sizes, apartments with size between 1000 and 1500 sqft (usually the 3 bedders) perform the best (the only positive r coefficient as compared to the other graphs). This shows clearly that you should seriously consider apartments between 1000 and 1500 sqft if you are looking at buying a condominium/apartment in D26.
For my regular readers, you will know that this is where I will briefly talk about the various different machine learning models and attempt to apply my machine learning model to determine a fair value for a certain property listing on PropertyGuru. If you have not read about this before, you may just refer to any of the district analysis I have done in my previous articles and you should be able to find it.
For the benefit of the regular readers, I'm going to remove the chunk of text and go straight to the analysis. Like mentioned in the earlier articles, I will talk more about these machine learning models and will probably do so when I have finished analysing all 28 districts in Singapore.
Running through all 369 transactions through several machine learning models, I eventually achieve a model which provides me with suitable evaluation results (MAE of 71805, RMSE of 113316 and R2 of 0.928).
I then now try to put this machine learning model to practice and use it to determine what should be a reasonable price for the following property.
Project: Bullion Park
Area: 1259 sqft
Floor level: Middle Floor (assume to be 06 to 10)
Running through the machine learning model which I have created, the price I have obtained is $1,401,768 which is almost the same as the asking price of $1,400,000. Also, the $psf requested over here is $1112 psf which is only slightly higher than 75th percentile pricing ($1099 psf) for the transactions pertaining to Bullion Park in the past 3 years. Hence, this asking price might be worthwhile to consider or look at, with potential grounds for negotiation. Please bear in mind though other facts such as renovation status, flat history etc are not taken into consideration here and they could also have an effect on the "fair price".
Now, with these data in mind, go be a data science investor! #datascienceinvestor
Refer here for analysis on the other districts!
Psst.. If you like what you read, please scroll down and subscribe for regular updates!


Comments