Buying a private property in District 21
- datascienceinvestor

- Jan 2, 2020
- 5 min read
Updated: May 17, 2020

(Photo credit: Wikipedia)
Date of Analysis: 1 January 2020
Period of data: Dec 2016 to Dec 2019
Number of transactions analyzed: 1818
(transaction data extracted from URA website)
District 21 is one of the districts within the RCR (Rest of Central Region) of Singapore. It comprises of few neighbourhoods such as Upper Bukit Timah, Clementi Park and Ulu Pandan. Some of the private properties in this region are The Hillford, Maple Woods and Pandan Valley etc. Recent new properties in the area are View at Kismis, Daintree Residences, Mayfair Gardens and Mayfair Modern.
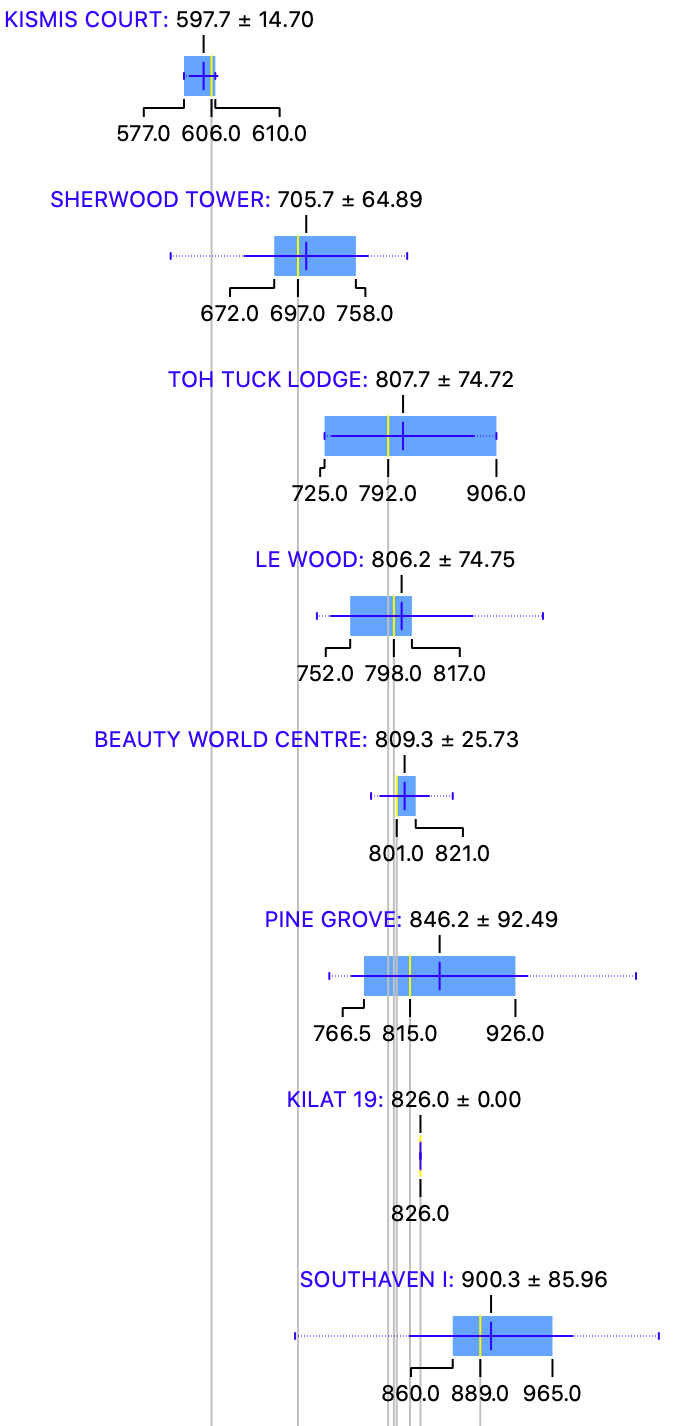
How do the private properties in D21 generally fare? Using box plots, here are the details for each of the properties in D21.

More box plots of other condominiums in this district (together with all the other districts) could be unlocked when you become a patron (https://www.patreon.com/datascienceinvestor)
To help you better understand the data, I will use Mayfair Gardens as an example here. From the diagram, you can see that

Average price- $1906.4 psf
Median price- $1937.5 psf
Price at 25th percentile- $1862 psf
Price at 75th percentile- $1990 psf
I personally think that box plot is a good way to present the data. In this case, you can easily see the average price, median price, price at 25th percentile and price at 75th percentile from the plots. You could also tell at one glance how wide the spread of prices are for any of the condominium projects. Pretty neat, I will think.
The metric used here is $psf as it is a common indicator to reflect property prices.
The most expensive condominium in D21 is Mayfair Modern with an average price of $2044.4 psf while the most affordable condominium in D21 is Kismis Court with an average price of $597.7 psf. Mayfair Modern is a 99 years leasehold property which was launched in 2019 and expected to TOP in 2024. It is also quite an unique development as it share the same site with Mayfair Gardens. The site was acquired by Oxley Holdings via an en bloc sale in Nov 2017.
Now, let's take a look at the various scatter plots to have a better insight of how the property prices perform across 1818 transactions in the past 3 years.

First, a scatter plot of the $psf against date.
In scatter plot, we could derive r coefficient, which is used to explain the strength of the linear relationship between 2 variables. Since we are using $psf and date as the variables, r coefficient allows us to better understand how the $psf changes with time. To some extent, if the r coefficient is high, we could roughly assume that the $psf increases positively with time. The r coefficient (or much simply/loosely put, the gradient for the line of best fit) in the scatter plot above is 0.38. This means that the $psf in D21 is enjoying a healthy increment over the past 3 years.
From this line of best fit, you could also better understand if you are "over-paying" for your property purchase (eg. if you property is above the line of best fit). Taking a quick glance at the scatter plot, your transaction will be on the high side if you are paying more than $1400 psf in Oct 2018. Of course, there could be many factors such as location, tenure etc that could influence your buying price. This is still a general assumption.
So, which projects perform remarkably well comparatively in the past 3 years?

The plot above shows a myriad of lines of best fit from various different projects in D21.
2 of the top performing projects from the graph above are Signature Park and Maple Woods. Both are freehold developments which had TOP a long time ago in 1990s. Comparatively, the new developments in D21 do not seem to be performing as well in the past 3 years.
Next, how do freehold perform against leasehold during this 3 years period?

I have only included freehold transactions in this plot and you could see that the r coefficient of 0.13 is much lesser than the r coefficient of 0.38 for the scatter plot with all transactions. This means that the freehold properties actually perform worse than leasehold properties in D21 and might not actually worth the premium.
Also, how about apartments of various sizes? How do they perform against each other?


The results are rather shocking. Apartments with size less than 500 sqft actually suffer a decrease in $psf over the past 3 years! That's really a shock as you will generally expect $psf to increase over the years. Granted you might not expect a big increase, but you certainly do not expect a decrease! This might suggest that 1 bedder/studio apartment in D21 might not be ideal investments.

What you have seen above are largely data insights that we have derive using the various data science tools. But, what if we could actually use these insights to build machine learning model to attempt to predict the prices of the properties in D21 and understand if the prices the seller is asking for is reasonable? How could we do that?
We could try various different machine learning models to attempt to do so. Some examples of such machine learning models we could use are random forest and linear regression. They are methods which we could generally use to apply regression techniques to attempt to construct a linear relationship between price and various other variables (in this case, it will be project name, date of sales, size of flat etc). What we ultimately try to construct is a predictive model which allows us to have the highest confidence in prediction by attempting to reducing as much prediction errors as possible (think about Mean Absolute Error and Root Mean Squared Error)
If you are already feeling confused at this point of time, don't be as these information are highly technical in nature. You may read up more about them if you want to. Otherwise, I believe the information above in the box plots and scatter plots are more than enough for you to better understand the property prices in D21. I will also attempt to explain or illustrate more of this in a separate post in the future.
Running through all 1818 transactions through several machine learning models, I eventually achieve a model which provides me with suitable evaluation results (MAE of 76139, RMSE of 126763 and R2 of 0.934).
I then now try to put this machine learning model to practice and use it to determine what should be a reasonable price for the following property.
Project: The Creek @ Bukit
Area: 1248 sqft
Floor level: 01 to 05
Running through the machine learning model which I have created, the price I have obtained is $1,959,919 which is lesser than the asking price of $2,128,000. This might then suggest that there is some room for price negotiation here. But of course, more investigation will also be needed to look at other factors beyond these parameters.
Of course, the above example is just a glimpse of what is achievable as you could actually use it to determine a lot more property prices in the region. In the future, I will also consider uploading this machine learning model online so you could actually use it to determine/predict property prices based on this model. But that's a story for another day.
Now, with these data in mind, go be a data science investor!

Psst.. If you like what you read, please scroll down and subscribe for regular updates!


Comments