Buying a private property in District 17
- datascienceinvestor

- Mar 4, 2020
- 6 min read
Updated: May 17, 2020

(Photo credit: Wikipedia)
Date of Analysis: 11 February 2020
Period of data: Feb 2017 to Feb 2020
Number of transactions analyzed: 1032
(transaction data extracted from URA website)
This is part of an ongoing series "Singapore Private Condominium Guide". Please refer to the link for analysis on the other districts.
District 17 is one of the districts within the OCR (Outside of Central Region) of Singapore. It comprises of few neighbourhoods such as Changi and Loyang. Some of the private properties in this region are Azalea Park Condominium and Parc Olympia etc. Some of the new projects in this district in recent years are The Jovell, Parc Komo and Casa Al Mare.
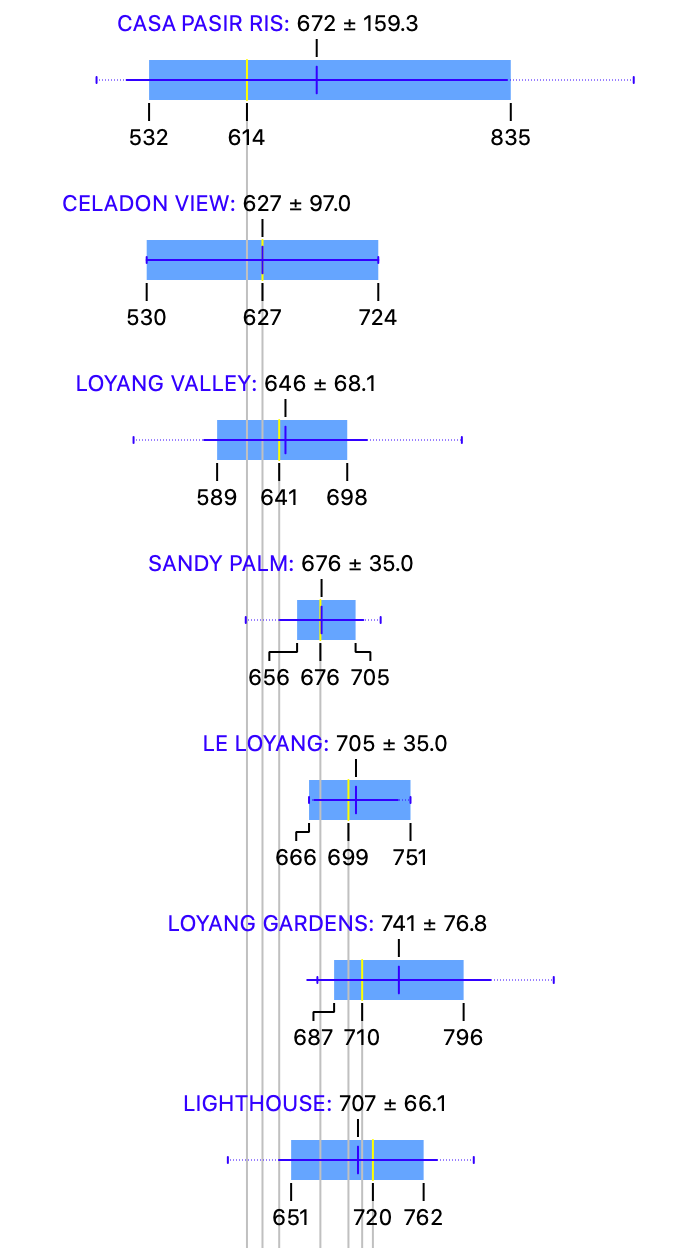
How do the private properties in D17 generally fare? Using box plots, here are the details for each of the properties in D17.

More box plots of other condominiums in this district (together with all the other districts) could be unlocked when you become a patron (https://www.patreon.com/datascienceinvestor)
To help you better understand the data, I will use Riz Haven as an example here. From the diagram, you can see that

Average price- $1012 psf
Median price- $952 psf
Price at 25th percentile- $912 psf
Price at 75th percentile- $1096 psf
Box plot is generally a good way to present the data. In this case, you can easily see the average price, median price, price at 25th percentile and price at 75th percentile from the plots. You could also easily tell at one glance how wide the spread of prices are for any of the condominium projects. It's interesting to note that the median price for Riz Haven is quite different from its average price, and is also much closer to the price at 25th percentile as compared to the price at 75th percentile. This shows that most of the transactions for Riz Haven happens below its average $psf.
The metric used here is $psf as it is a common indicator to reflect property prices.
The most expensive condominium in D17 is Casa Al Mare with an average price of $1598 psf while the most affordable condominium in D17 is Casa Pasir Ris with an average price of $672 psf.
Casa Al Mare is a recent freehold boutique condominium project (only 49 units) which was recently launched and expected to TOP in 2022. Location wise, it's really not great as it takes 16 minutes for you to walk to Pasir Ris MRT station and even then Pasir Ris MRT station is already at the end of the East West Line. I guess this condominium is catered for buyers who want to experience beach resort living by the sea in Singapore, not any other average Singaporean.
Casa Pasir Ris is a 999 year leasehold condominium project which TOP in 1997. Similar to Casa Al Mare, it has a really out-of-the-way location with the Pasir Ris MRT station being a good 1.77km away (that could really take you more than 20 minutes to walk).
Let's take a look at the various scatter plots to have a better insight of how the property prices perform across 1032 transactions in the past 3 years.

First, a scatter plot of the $psf against date.
In scatter plot, we could derive r coefficient, which is used to explain the strength of the linear relationship between 2 variables. Since we are using $psf and date as the variables, r coefficient allows us to better understand how the $psf changes with time. To some extent, if the r coefficient is high, we could roughly assume that the $psf increases positively with time.
The r coefficient (or much simply/loosely put, the gradient for the line of best fit) in the scatter plot above is an amazing 0.52! This is certainly the best increment of $psf over the past 3 years for all the districts which I have analyzed so far. I'm surprised that this actually comes from an OCR district.

Based on the graph above, you could also better understand if you are "over-paying" for your property purchase (eg. if you property is above the line of best fit). Taking a quick glance at the scatter plot, your transaction will be on the high side if you are paying more than $1100 psf in Feb 2019. Of course, there could be many factors such as location, tenure etc that could influence your buying price. This is still a general assumption.
So, which projects perform remarkably well comparatively amid the general decline in the district in the past 3 years?

The plot above shows a myriad of lines of best fit from various different projects in D17.
Some of top performing projects from the graph are Carissa Park Condominium and Ferraria Park Condominium. Carissa Park Condominium is a freehold condominium project which TOP in 2003. Similar to most condominiums which I have briefly talked about in this article, Carissa Park Condominium has a less than ideal location with the nearest MRT station (Tampines East) being a good 2.6km away. Ferraria Park Condominium is similar, with a freehold status and also a less than ideal location with the nearest MRT station (Tampines) being a good 3.2km away. Now, there are really many freehold projects around in D17...
Next, how do freehold perform against leasehold during this 3 years period?

I have only included freehold transactions in this plot and you could see that the r coefficient of 0.61 is better than the r coefficient of 0.52 for the scatter plot with all transactions. From the comparison of the graphs, we can generally infer that freehold properties might be better investments in D17 for the past 3 years and thus worth the premium. But key thing to note here is that we could see an "outlier" group of data points on the upright corner of the graph. These data points are likely the transactions for the new freehold projects in D17 (Parc Komo, Casa Al Mare) which have a much higher $psf than the older projects and thus brings up the gradient.
Also, how about apartments of various sizes? How do they perform against each other?


As expected, apartments of all sizes perform rather well generally with the "common sizes" representing apartment sizes between 500 and 1500 sqft (usually the 2, 3 bedders) performing the best- in line with general market expectations.

What you have seen above are largely data insights that we have derive using the various data science tools. But, what if we could actually use these insights to build machine learning model to attempt to predict the prices of the properties in D17 and understand if the prices the seller is asking for is reasonable? How could we do that?
We could try various different machine learning models to attempt to do so. Some examples of such machine learning models we could use are random forest and linear regression. They are methods which we could generally use to apply regression techniques to attempt to construct a linear relationship between price and various other variables (in this case, it will be project name, date of sales, size of flat etc). What we ultimately try to construct is a predictive model which allows us to have the highest confidence in prediction by attempting to reducing as much prediction errors as possible (think about Mean Absolute Error and Root Mean Squared Error)
If you are already feeling confused at this point of time, don't be as these information are highly technical in nature. You may read up more about them if you want to. Otherwise, I believe the information above in the box plots and scatter plots are more than enough for you to better understand the property prices in D17. I will also attempt to explain or illustrate more of this in a separate post in the future.
Running through all 1032 transactions (little but that's all we have) through several machine learning models, I eventually achieve a model which provides me with suitable evaluation results (MAE of 76230, RMSE of 114809 and R2 of 0.98).
I then now try to put this machine learning model to practice and use it to determine what should be a reasonable price for the following property.
Project: Parc Olympia
Area: 1023 sqft
Floor level: 01 to 05
Running through the machine learning model which I have created, the price I have obtained is $1,166,445 which is higher than the asking price of $1,028,000. This might then suggest the asking price is reasonable in this case. But of course, more investigation will also be needed to look at other factors beyond these parameters.
Of course, the above example is just a glimpse of what is achievable as you could actually use it to determine a lot more property prices in the region. In the future, I will also consider uploading this machine learning model online so you could actually use it to determine/predict property prices based on this model. But that's a story for another day.
Now, with these data in mind, go be a data science investor!

Refer here for analysis on the other districts!
Psst.. If you like what you read, please scroll down and subscribe for regular updates!


Comments