Buying a private property in District 16
- datascienceinvestor

- Jan 28, 2020
- 6 min read
Updated: May 17, 2020

(Photo credit: Wikipedia)
Date of Analysis: 19 January 2020
Period of data: Jan 2017 to Jan 2020
Number of transactions analyzed: 2442
(transaction data extracted from URA website)
District 16 is one of the districts within the OCR (Outside of Central Region) of Singapore. It comprises of few neighbourhoods such as Upper East Coast, Siglap and Bedok. Some of the private properties in this region are Aquarius By The Park, Bedok Residences and East Meadows etc. There aren't many new projects in this district recently with Grandeur Park Residences and Sea Pavilion Residences being the only two new projects in the past few years.
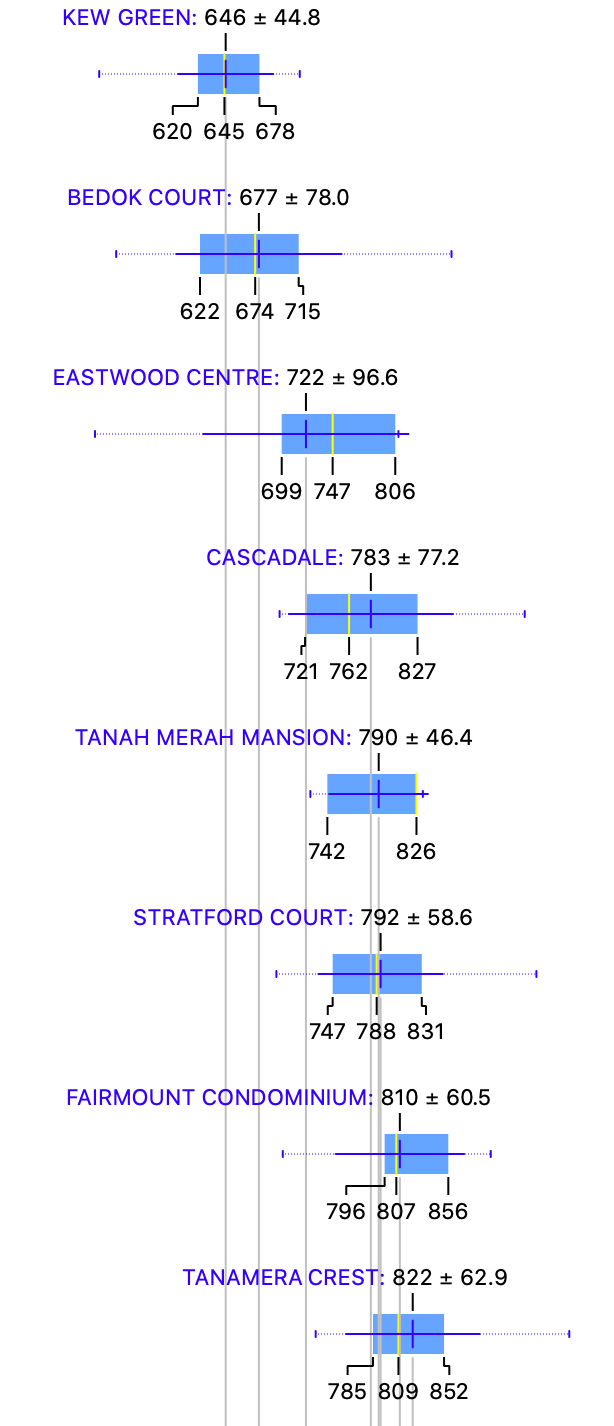
How do the private properties in D16 generally fare? Using box plots, here are the details for each of the properties in D16.

More box plots of other condominiums in this district (together with all the other districts) could be unlocked when you become a patron (https://www.patreon.com/datascienceinvestor)
To help you better understand the data, I will use The Glades as an example here. From the diagram, you can see that

Average price- $1453 psf
Median price- $1459 psf
Price at 25th percentile- $1328 psf
Price at 75th percentile- $1566 psf
Box plot is generally a good way to present the data. In this case, you can easily see the average price, median price, price at 25th percentile and price at 75th percentile from the plots. You could also easily tell at one glance how wide the spread of prices are for any of the condominium projects.
The metric used here is $psf as it is a common indicator to reflect property prices.
The most affordable condominium in D16 is Kew Green with an average price of $646 psf while the most expensive condominium in D16 is Sea Pavilion Residences with an average price of $1761 psf. Sea Pavilion Residences is a freehold property which is expected to TOP in 2023. It is a very small development with only 24 units in total! You rarely see such a small development around. The upcoming Bayshore MRT will be only 500m away from this development.
Let's take a look at the various scatter plots to have a better insight of how the property prices perform across 2442 transactions in the past 3 years.

First, a scatter plot of the $psf against date.
In scatter plot, we could derive r coefficient, which is used to explain the strength of the linear relationship between 2 variables. Since we are using $psf and date as the variables, r coefficient allows us to better understand how the $psf changes with time. To some extent, if the r coefficient is high, we could roughly assume that the $psf increases positively with time.
The r coefficient (or much simply/loosely put, the gradient for the line of best fit) in the scatter plot above is an alarming -0.20. This means that the $psf in D16 is actually decreasing over the past 3 years! This is similar to D22, except that D16 actually suffer a greater decline in $psf. The lack of new condominium projects in these 2 areas could have also contributed to the decline of $psf in the area as new condominium projects will usually bring up the $psf in the district as their $psf are usually higher.

Based on the graph above, you could also better understand if you are "over-paying" for your property purchase (eg. if you property is above the line of best fit). Taking a quick glance at the scatter plot, your transaction will be on the high side if you are paying more than $1150 psf in Feb 2019. Of course, there could be many factors such as location, tenure etc that could influence your buying price. This is still a general assumption.
So, which projects perform remarkably well comparatively amid the general decline in the district in the past 3 years?

The plot above shows a myriad of lines of best fit from various different projects in D16.
2 of the top performing projects from the graph above are Aquarius By The Park and The Bayshore. Both projects have TOP for quite a long period of time. Aquarius By The Park TOP in 2000 while The Bayshore TOP in 1999. Both are 99-year leasehold projects. Aquarius By The Park enjoyed a good location with the Bedok Reservoir MRT station being on 6 minutes walk away- that could explain the good performance of the project in the past 3 years.
Next, how do freehold perform against leasehold during this 3 years period?

I have only included freehold transactions in this plot and you could see that the r coefficient of 0.30 is much better than the r coefficient of -0.20 for the scatter plot with all transactions. The reason for this difference could be that the new freehold development- Sea Pavilion Residences actually greatly brings up the $psf for freehold properties in D16. The lack of many new 99 year leasehold properties in the recent years then cause the leasehold properties to pale in comparison in terms of growth of $psf as compared to freehold properties.
From the comparison of the graphs, we can generally infer that freehold properties might be better investments in D16 for the past 3 years and thus worth the premium.
Also, how about apartments of various sizes? How do they perform against each other?


Apartments of all sizes generally stagnate in terms of growth of $psf, with the exception of apartment of size between 500 and 1000 sqft (usually 2 or 3 bedders). This group performs especially bad, with an r coefficient of -0.22. This means the $psf for this group actually decreases over the past 3 years! This is certainly unique, and is the first I seen among all the districts which I have analyzed so far.

What you have seen above are largely data insights that we have derive using the various data science tools. But, what if we could actually use these insights to build machine learning model to attempt to predict the prices of the properties in D16 and understand if the prices the seller is asking for is reasonable? How could we do that?
We could try various different machine learning models to attempt to do so. Some examples of such machine learning models we could use are random forest and linear regression. They are methods which we could generally use to apply regression techniques to attempt to construct a linear relationship between price and various other variables (in this case, it will be project name, date of sales, size of flat etc). What we ultimately try to construct is a predictive model which allows us to have the highest confidence in prediction by attempting to reducing as much prediction errors as possible (think about Mean Absolute Error and Root Mean Squared Error)
If you are already feeling confused at this point of time, don't be as these information are highly technical in nature. You may read up more about them if you want to. Otherwise, I believe the information above in the box plots and scatter plots are more than enough for you to better understand the property prices in D16. I will also attempt to explain or illustrate more of this in a separate post in the future.
Running through all 2442 transactions through several machine learning models, I eventually achieve a model which provides me with suitable evaluation results (MAE of 33825, RMSE of 53175 and R2 of 0.984).
I then now try to put this machine learning model to practice and use it to determine what should be a reasonable price for the following property.
Project: Waterfront Waves
Area: 1250 sqft
Floor level: Low Floor (assume to be 01 to 05)
Running through the machine learning model which I have created, the price I have obtained is $1,338,009 which is slightly less than the asking price of $1,450,000. This might then suggest that the asking price is slightly on the high side, and there is room for negotiation here based on the results of the trained model. But of course, more investigation will also be needed to look at other factors beyond these parameters.
Of course, the above example is just a glimpse of what is achievable as you could actually use it to determine a lot more property prices in the region. In the future, I will also consider uploading this machine learning model online so you could actually use it to determine/predict property prices based on this model. But that's a story for another day.
Now, with these data in mind, go be a data science investor!

Psst.. If you like what you read, please scroll down and subscribe for regular updates!


Comments