Buying a private property in District 15
- datascienceinvestor

- Mar 25, 2020
- 6 min read
Updated: May 17, 2020

(Photo credit: Wikipedia)
Date of Analysis: 8 March 2020
Period of data: Mar 2017 to Mar 2020
Number of transactions analyzed: 4521
(transaction data extracted from URA website)
This is part of an ongoing series "Singapore Private Condominium Guide". Please refer to the link for analysis on the other districts.
District 15 is one of the prime districts within the RCR (Rest of Core Central Region) of Singapore. It comprises of few neighbourhoods such as Katong, Marine Parade and Tanjong Rhu. Some of the private properties in this region are The Seafront on Meyer, Haig 162 and Marine Blue etc (just to name a few). There are around 400 condominium/apartment projects which have transactions in the last 3 years- this is an alarming number for an RCR district! Such number is usually only present in the CCR districts. A total number of 4521 transactions in the past 3 years is by far the highest number of transactions I see in an RCR district!
There are plenty of new launches in this district for the past few years. Some of them might sound very familiar to you. For instance, Amber Park, Nyon, Meyer Mansion, Coastline Residences (again, just to name a few)
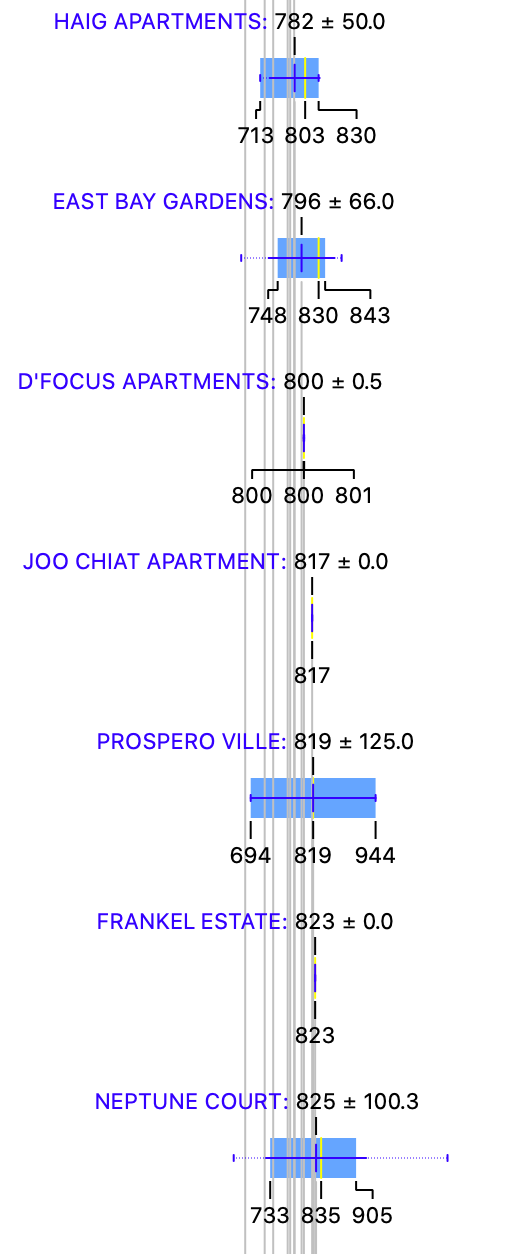
How do the private properties in D15 generally fare? Using box plots, here are the details for each of the properties in D15.
As there are too many condominium projects in D15, I will break up the box plots section into a few portions here.

More box plots of other condominiums in this district (together with all the other districts) could be unlocked when you become a patron (https://www.patreon.com/datascienceinvestor)
To help you better understand the data, I will use Meyer Mansion as an example here. From the diagram, you can see that

Average price- $2749 psf
Median price- $2686 psf
Price at 25th percentile- $2630 psf
Price at 75th percentile- $2783 psf
I personally think that box plot is a good way to present the data. In this case, you can easily see the average price, median price, price at 25th percentile and price at 75th percentile from the plots. You could also tell at one glance how wide the spread of prices are for any of the condominium projects. Pretty neat, I will think.
The metric used here is $psf as it is a common indicator to reflect property prices.
The most expensive condominium in D15 is Meyer Mansion with an average price of $2749 psf. I got to say this is a pretty hefty price tag to pay for a condominium project in RCR district. It's a new project, and thankfully it is freehold! (for such a price, it better be freehold) Guocoland Group has plans to make this project an iconic one in D15, with 80% of the development devoted to landscaping and amenities. Its location is also strategic. Situated along Meyer Road means that it will only need less than 10 minutes to get to airport or town by car. Even if you don't drive, the upcoming Katong Park MRT station is just 6 minutes walk away. The project is expected to TOP in 2024.
The most affordable condominium (asides from apartments) in D15 is East Bay Gardens with an average price of $796 psf. East Bay Gardens is a 99 year leasehold condominium which TOP in 1995. Location wise, it's actually not bad with Kembangan MRT station only 5 minutes walk away!
Now, let's take a look at the various scatter plots to have a better insight of how the property prices perform across 4521 transactions in the past 3 years.

First, a scatter plot of the $psf against date.
In scatter plot, we could derive r coefficient, which is used to explain the strength of the linear relationship between 2 variables. Since we are using $psf and date as the variables, r coefficient allows us to better understand how the $psf changes with time. To some extent, if the r coefficient is high, we could roughly assume that the $psf increases positively with time. The r coefficient (or much simply/loosely put, the gradient for the line of best fit) in the scatter plot above is 0.15. This indicates that the $psf is increasing with time in the past 3 years, albeit not a huge one.
From this line of best fit, you could also better understand if you are "over-paying" for your property purchase (eg. if you property is above the line of best fit). Taking a quick glance at the scatter plot, your transaction will be on the high side if you are paying more than $1600 psf in Oct 2019. Of course, there could be many factors such as location, tenure etc that could influence your buying price. This is still a general assumption.
So, which projects perform remarkably well comparatively in the past 3 years?

The plot above shows a myriad of lines of best fit from various different projects in D15.
2 of the top performing projects from the graph above are Mandarin Gardens and Neptune Court. Mandarin Gardens is a pleasant surprise here as it's a really old 99 year leasehold development which TOP in 1986. It's also quite a big development with more than 1000 units. In 2019, there was a failed enbloc attempt after it failed to get 80% approval from the owners. The appreciation might thus be due to this as buyers might have anticipate an enbloc attempt and do not mind paying a premium for it. Though this enbloc attempt failed, there might be another one in the future.
Neptune Court is an old 99 year leasehold apartment project (note that it's not a condominium) which TOP in 1975. Despite its old age, it still enjoy very good price appreciation over the past 3 years. It is in very close proximity to East Coast Park and Orchard Road is just 15-20 minutes drive away.
The interesting situation over here is that both of these projects are old 99 year leasehold projects, yet they enjoy good price appreciation contrary to conventional thinking that old 99 year leasehold projects have less price appreciation potential.
Next, how do freehold perform against leasehold during this 3 years period?

I have only included freehold transactions in this plot and you could see that the r coefficient of 0.25 is higher than the r coefficient of 0.15 for the scatter plot with all transactions. This means that the freehold properties in D15 perform better compared to the leasehold properties in D15 in terms of $psf over the past 3 years. Do note that there is tremendous number of freehold properties in D15. In the past 3 years alone, we have transactions for 375 different condominium/apartment projects in D15. This is huge, considering that are transactions for 400 different condominium/apartment projects in D15 for the past 3 years, and almost 94% are freehold projects!
Also, how about apartments of various sizes? How do they perform against each other?


Apartments with sizes of less than 500 sqft (usually studio or the 1 bedder) perform the best in terms of growth of $psf over the past 3 years. This seems to be a common trend among the districts which are central or very near to central. Apartments with sizes more than 1500 sqft (usually the penthouse or 4 bedder and above) came in second, followed by apartments with sizes between 500 and 1000 sqft (usually the 2 bedders), and finally apartments with sizes between 1000 and 1500 sqft (usually the 3 bedders).
For my regular readers, you will know that this is where I will briefly talk about the various different machine learning models and attempt to apply my machine learning model to determine a fair value for a certain property listing on PropertyGuru. If you have not read about this before, you may just refer to any of the district analysis I have done in my previous articles and you should be able to find it.
For the benefit of the regular readers, I'm going to remove the chunk of text and go straight to the analysis. Like mentioned in the earlier articles, I will talk more about these machine learning models and will probably do so when I have finished analysing all 28 districts in Singapore.
Running through all 4521 transactions through several machine learning models, I eventually achieve a model which provides me with suitable evaluation results (MAE of 505970, RMSE of 5850387 and R2 of 0.861).
I then now try to put this machine learning model to practice and use it to determine what should be a reasonable price for the following property.
Project: Amber Skye
Area: 1216 sqft
Floor level: Middle Floor (assume to be 06 to 10)
Running through the machine learning model which I have created, the price I have obtained is $2,390,220 which is higher than the asking price of $2,200,000. Considering the $psf requested over here is $1809 psf which is less than 25th percentile pricing ($1887 psf) for the transactions pertaining to Amber Skye in the past 3 years, this asking price might be worthwhile to consider or look at. Please bear in mind though other facts such as renovation status, flat history etc are not taken into consideration here and they could also have an effect on the "fair price".
Now, with these data in mind, go be a data science investor! #datascienceinvestor
Refer here for analysis on the other districts!
Psst.. If you like what you read, please scroll down and subscribe for regular updates!


Comments