Buying a private property in District 14
- datascienceinvestor

- Jan 17, 2020
- 5 min read
Updated: May 17, 2020
(Photo credit: Wikipedia)
Date of Analysis: 10 January 2020
Period of data: Jan 2017 to Dec 2019
Number of transactions analyzed: 3939
(transaction data extracted from URA website)
District 14 is one of the districts within the RCR (Rest of Central Region) of Singapore. It comprises of few neighbourhoods such as Geylang, Eunos and Paya Lebar. Some of the private properties in this region are Simsville, Rezi 26 and The Alcove etc. Recent new properties in the area are Rezi 24, Parc Esta, Park Place Residences at PLQ and Urban Treasures.
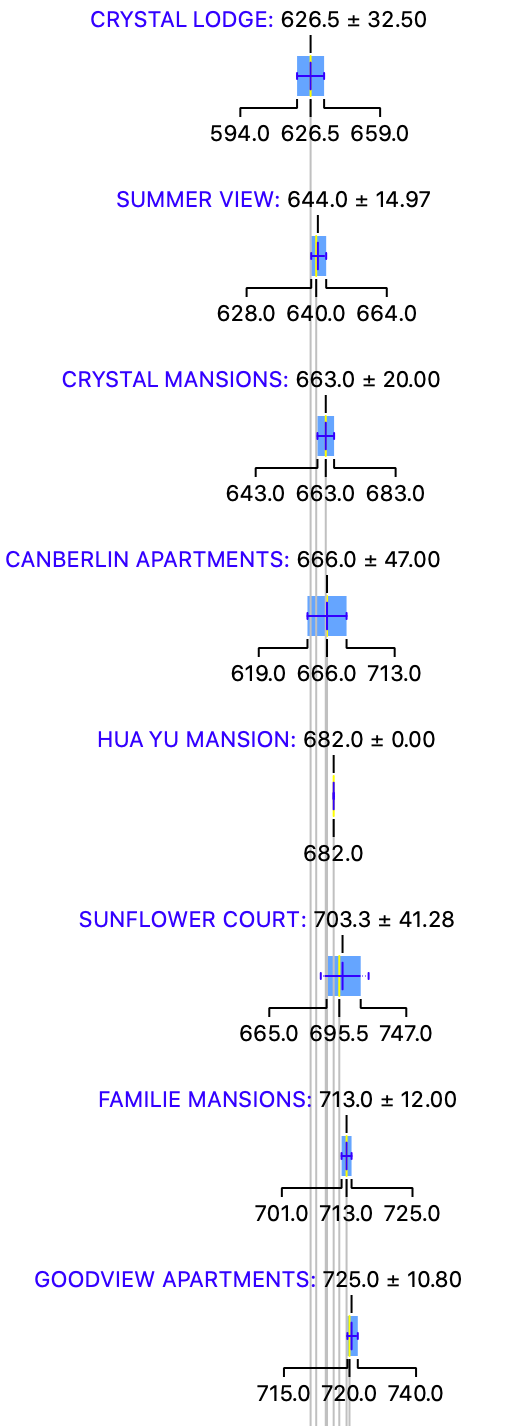
How do the private properties in D14 generally fare? Using box plots, here are the details for each of the properties in D14.

More box plots of other condominiums in this district (together with all the other districts) could be unlocked when you become a patron (https://www.patreon.com/datascienceinvestor)
To help you better understand the data, I will use Central Grove as an example here. From the diagram, you can see that

Average price- $963.3 psf
Median price- $962 psf
Price at 25th percentile- $904.5 psf
Price at 75th percentile- $1037.5 psf
I personally think that box plot is a good way to present the data. In this case, you can easily see the average price, median price, price at 25th percentile and price at 75th percentile from the plots. You could also tell at one glance how wide the spread of prices are for any of the condominium projects. Pretty neat, I will think.
The metric used here is $psf as it is a common indicator to reflect property prices.
The most expensive condominium in D14 is Urban Treasures with an average price of $1963.5 psf while the most affordable condominium in D14 is Crystal Lodge with an average price of $626.5 psf. Urban Treasures is a recent freehold property which is expected to TOP in 2023. It is within walking distance of Kaki Bukit and Ubi MRT stations, though the journey will take you around 12 mins to either of them. Crystal Lodge is also a freehold property but has TOP in 2001. Its location can be comparable to Urban Treasures though, with three MRT stations (Aljunied, Kallang and Mountbatten) within 10 to 15 minutes of walking distance.
Now, let's take a look at the various scatter plots to have a better insight of how the property prices perform across 3939 transactions in the past 3 years.

First, a scatter plot of the $psf against date.
In scatter plot, we could derive r coefficient, which is used to explain the strength of the linear relationship between 2 variables. Since we are using $psf and date as the variables, r coefficient allows us to better understand how the $psf changes with time. To some extent, if the r coefficient is high, we could roughly assume that the $psf increases positively with time. The r coefficient (or much simply/loosely put, the gradient for the line of best fit) in the scatter plot above is 0.25. This generally means that the $psf is increasing in the past 3 years, and thus property in D14 generally enjoy price appreciation.
From this line of best fit, you could also better understand if you are "over-paying" for your property purchase (eg. if you property is above the line of best fit). Taking a quick glance at the scatter plot, your transaction will be on the high side if you are paying more than $1450 psf in Oct 2018. Of course, there could be many factors such as location, tenure etc that could influence your buying price. This is still a general assumption.
So, which projects perform remarkably well comparatively in the past 3 years?

The plot above shows a myriad of lines of best fit from various different projects in D14.
2 of the top performing projects from the graph above are Simsville and Sims Urban Oasis. Simsville is a 99 year leasehold property which is a bit old as its TOP date is in 1998. However, it's within 6 minutes walking distance to Paya Lebar MRT station and that makes it really accessible to many locations. Sims Urban Oasis is a 99 year leasehold which is completed recently and also enjoys a good location (5 minutes walking distance to Aljunied).
Next, how do freehold perform against leasehold during this 3 years period?

I have only included freehold transactions in this plot and you could see that the r coefficient of 0.29 is better than the r coefficient of 0.25 for the scatter plot with all transactions. This means that the freehold properties actually perform better than leasehold properties in D14 and might be good buys. Out of the various districts which I have analyzed so far, D9 is the only other district where freehold perform better than leasehold properties.

Also, how about apartments of various sizes? How do they perform against each other?


Apartment with sizes between 500 and 1500 sqft (generally 2 bedders, 3 bedders and sometimes 4 bedders) perform similarly. The other apartments with size below 500 sqft/more than 1500 sqft don't perform as well and they are usually either very small apartments (studio/1bedder) or really huge apartments (penthouse).
What you have seen above are largely data insights that we have derive using the various data science tools. But, what if we could actually use these insights to build machine learning model to attempt to predict the prices of the properties in D14 and understand if the prices the seller is asking for is reasonable? How could we do that?
We could try various different machine learning models to attempt to do so. Some examples of such machine learning models we could use are random forest and linear regression. They are methods which we could generally use to apply regression techniques to attempt to construct a linear relationship between price and various other variables (in this case, it will be project name, date of sales, size of flat etc). What we ultimately try to construct is a predictive model which allows us to have the highest confidence in prediction by attempting to reducing as much prediction errors as possible (think about Mean Absolute Error and Root Mean Squared Error)
If you are already feeling confused at this point of time, don't be as these information are highly technical in nature. You may read up more about them if you want to. Otherwise, I believe the information above in the box plots and scatter plots are more than enough for you to better understand the property prices in D14. I will also attempt to explain or illustrate more of this in a separate post in the future.
Running through all 3939 transactions through several machine learning models, I eventually achieve a model which provides me with suitable evaluation results (MAE of 121452, RMSE of 169354 and R2 of 0.971).
I then now try to put this machine learning model to practice and use it to determine what should be a reasonable price for the following property.
Project: Dakota Residences
Area: 1292sqft
Floor level: High (i'm going to assume it is from level 16 to 20)
Running through the machine learning model which I have created, the price I have obtained is $1,951,151 which is less than the asking price of $2,150,000. This might then suggest that the asking price might be a bit high and you might have some room for price negotiation. But of course, more investigation will also be needed to look at other factors beyond these parameters.
Of course, the above example is just a glimpse of what is achievable as you could actually use it to determine a lot more property prices in the region. In the future, I will also consider uploading this machine learning model online so you could actually use it to determine/predict property prices based on this model. But that's a story for another day.
Now, with these data in mind, go be a data science investor!

Psst.. If you like what you read, please scroll down and subscribe for regular updates!


Comments