Buying a private property in District 12
- datascienceinvestor

- Apr 8, 2020
- 6 min read
Updated: May 17, 2020

(Photo credit: Wikipedia)
Date of Analysis: 23 March 2020
Period of data: Mar 2017 to Mar 2020
Number of transactions analyzed: 1789
(transaction data extracted from URA website)
This is part of an ongoing series "Singapore Private Condominium Guide". Please refer to the link for analysis on the other districts.
District 12 is one of the districts within the RCR (Rest of Core Central Region) of Singapore. It comprises of few neighbourhoods such as Toa Payoh, Serangoon and Balestier. Some of the private properties in this region are Eight Riversuites and Vista Residences etc. New condominium projects in this region are quite plenty with examples such as Verticus, Jui Residences, 1953, Neem Tree (just to name a few).
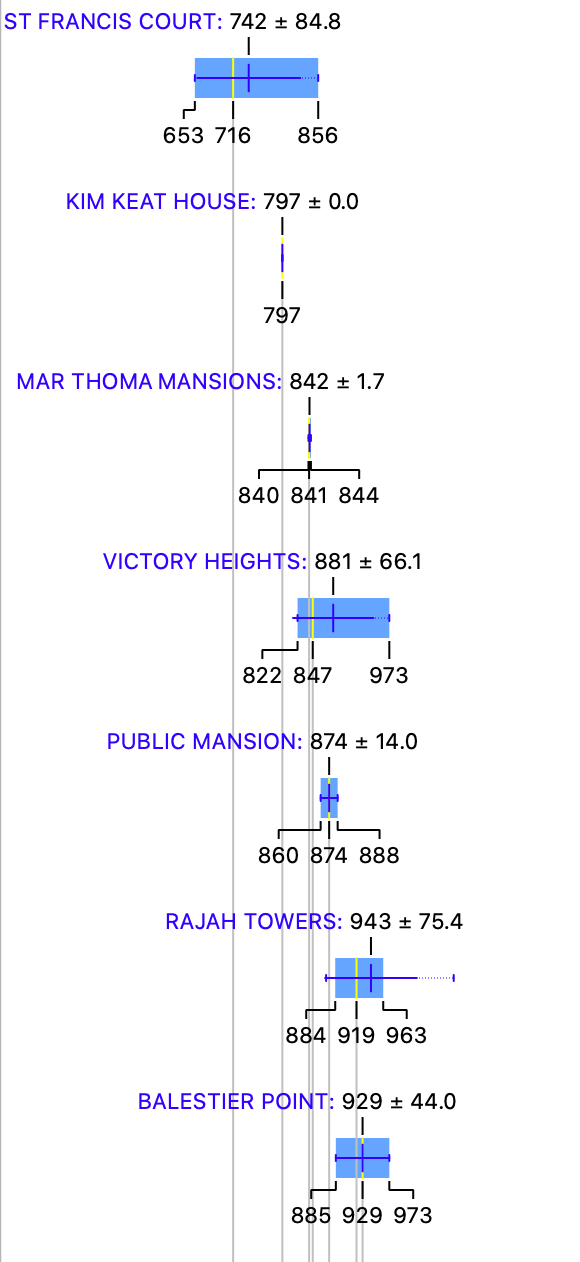
How do the private properties in D12 generally fare? Using box plots, here are the details for each of the properties in D12.

More box plots of other condominiums in this district (together with all the other districts) could be unlocked when you become a patron (https://www.patreon.com/datascienceinvestor)
To help you better understand the data, I will use Victory Heights as an example here. From the diagram, you can see that

Average price- $881 psf
Median price- $847 psf
Price at 25th percentile- $822 psf
Price at 75th percentile- $973 psf
I personally think that box plot is a good way to present the data. In this case, you can easily see the average price, median price, price at 25th percentile and price at 75th percentile from the plots. You could also tell at one glance how wide the spread of prices are for any of the condominium projects. Pretty neat, I will think.
The metric used here is $psf as it is a common indicator to reflect property prices.
The most expensive condominium/apartment in D12 is Kallang Riverside with an average price of $2288 psf. The most affordable condominium/apartment in D12 is St Francis Court with an average price of $742 psf. Kallang Riverside is a freehold property which was recently completed in 2019. I personally like the fact that it has river view and is yet situated relatively close to a MRT station (7 minutes walk to Lavender MRT station). This is also probably why it charged a premium. The other project which I could think of fitting into the criteria of a river view and within close proximity to a MRT station will be The Tre Ver in D13.
St Francis Court is a 99 year leasehold project with only 71 units and was completed in 1994. Though it is an apartment, it has almost full condominium facilities like a swimming pool and 24 hour security. Nearest MRT station is Boon Keng MRT station which is 9 minutes walk away.
Now, let's take a look at the various scatter plots to have a better insight of how the property prices perform across 1789 transactions in the past 3 years.

First, a scatter plot of the $psf against date.
In scatter plot, we could derive r coefficient, which is used to explain the strength of the linear relationship between 2 variables. Since we are using $psf and date as the variables, r coefficient allows us to better understand how the $psf changes with time. To some extent, if the r coefficient is high, we could roughly assume that the $psf increases positively with time. The r coefficient (or much simply/loosely put, the gradient for the line of best fit) in the scatter plot above is 0.08. This indicates that the $psf in D12 is hardly increasing with time in the past 3 years.
From this line of best fit, you could also better understand if you are "over-paying" for your property purchase (eg. if you property is above the line of best fit). Taking a quick glance at the scatter plot, your transaction will be on the high side if you are paying more than $1500 psf in Dec 2019. Of course, there could be many factors such as location, tenure etc that could influence your buying price. This is still a general assumption.
So, which projects perform remarkably well comparatively in the past 3 years?

The plot above shows a myriad of lines of best fit from various different projects in D12.
2 of the top performing projects from the graph above are The Arte and Neem Tree. The Arte is a freehold condominium project which was completed in 2012. Location wise, it's not too fantastic as the nearest MRT station (Novena MRT station) is a good 12 minutes away. Aside from its freehold status which people usually pay a premium for, I couldn't see any other factors which make it distinguishable from other projects. (To the readers, do let me know if you know of any)
Neem Tree is a new freehold condominium in D12 which is expected to complete this year, 2020. It has a low density of only 84 units and also has a less than ideal location with the nearest MRT station (Toa Payoh) being a 11 minutes walk away. However, I will think that the selling point here is that Neem Tree is located in a quiet and peaceful neighbourhood in D12, but remains close to Shaw Plaza and many eateries along Balestier Road. This might appeal to some groups of tenants/property buyers.
Next, how do freehold perform against leasehold during this 3 years period?

I have only included freehold transactions in this plot and you could see that the r coefficient of 0.13 is not too different from the r coefficient of 0.08 for the scatter plot with all transactions. This means that the freehold properties in D12 perform quite similarly to the leasehold properties in D12 in terms of $psf over the past 3 years. An interesting thing to note here is that there is a huge proportion of freehold properties in D12. Out of 101 different condominium/apartment projects which were transacted in the past 3 years, 89 of them were actually freehold! This also explains why there isn't too much of a difference for this plot as compared to the previous plot with all transactions (from both freehold and leasehold).
How about apartments of various sizes? How do they perform against each other?


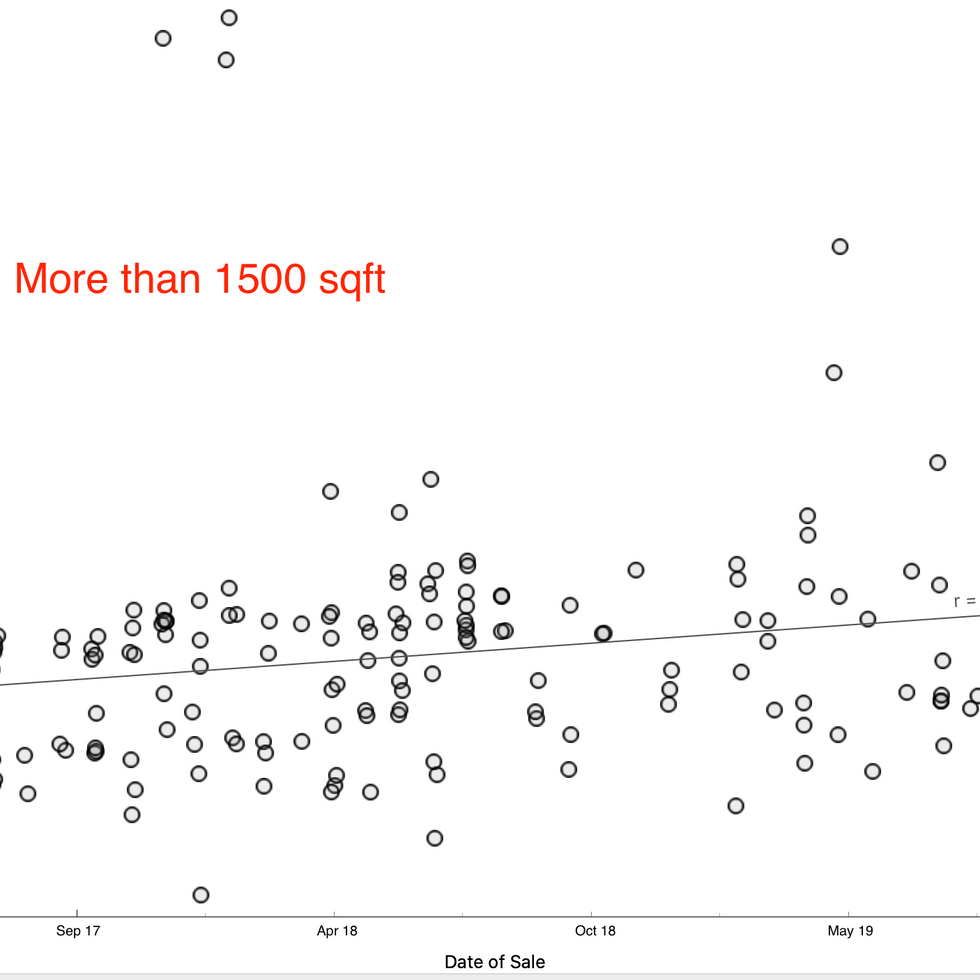
Not much big differences between the apartments of different sizes in D12. Apartments with sizes more than 1500 sqft (typically 4 bedders or penthouse) perform the best with a r coefficient of 0.19. Apartments with sizes between 1000 and 1500 sqft (typically the 3 bedders) have a flat growth with a r coefficient of 0.
For my regular readers, you will know that this is where I will briefly talk about the various different machine learning models and attempt to apply my machine learning model to determine a fair value for a certain property listing on PropertyGuru. If you have not read about this before, you may just refer to any of the district analysis I have done in my previous articles and you should be able to find it.
For the benefit of the regular readers, I'm going to remove the chunk of text and go straight to the analysis. Like mentioned in the earlier articles, I will talk more about these machine learning models and will probably do so when I have finished analyzing all 28 districts in Singapore.
Running through all 1789 transactions through several machine learning models, I eventually achieve a model which provides me with suitable evaluation results. (MAE of 126753, RMSE of 235424 and R2 of 0.997).
I then now try to put this machine learning model to practice and use it to determine what should be a reasonable price for the following property.
Project: The Arte
Area: 1055 sqft
Floor level: High Floor (assume to be 11 to 15)
Running through the machine learning model which I have created, the price I have obtained is $1,548,399 which is lesser than the asking price of $1,688,000. Considering the $psf requested over here is $1600 psf which is way higher than 75th percentile pricing ($1284 psf) for the transactions pertaining to The Arte in the past 3 years, I will say that this asking price seems to be on the high side and you might want to find out what exactly is the premium here. Please bear in mind though other facts such as renovation status, flat history etc are not taken into consideration here and they could also have an effect on the "fair price".
Now, with these data in mind, go be a data science investor! #datascienceinvestor
Refer here for analysis on the other districts!
Psst.. If you like what you read, please scroll down and subscribe for regular updates!


Comments