Buying a private property in District 11
- datascienceinvestor

- May 13, 2020
- 6 min read
Updated: May 17, 2020

(Photo credit: Wikipedia)
Date of Analysis: 7 May 2020
Period of data: Apr 2017 to Apr 2020
Number of transactions analyzed: 1466
(transaction data extracted from URA website)
This is part of an ongoing series "Singapore Private Condominium Guide". Please refer to the link for analysis on the other districts.
District 11 is one of the districts within the CCR (Core Central Region) of Singapore. It comprises of few areas such as Novena, Newton and Thomson. Some of the private properties in this region are Sky@Eleven, Adam Park Condominium and Thomson 800 etc. Like many of the CCR districts, there are tons of private properties project in these districts. Hence, these examples are just a drop in the ocean. Some of the new launches in this district in the recent years are Neu at Novena, Pullman Residences Newton, Dunearn 386 and Fyve Derbyshire (just to name a few). Compared to other CCR districts (D9, D10) which are near to D11, the number of transactions in this district for the past 3 years is only about half as much.
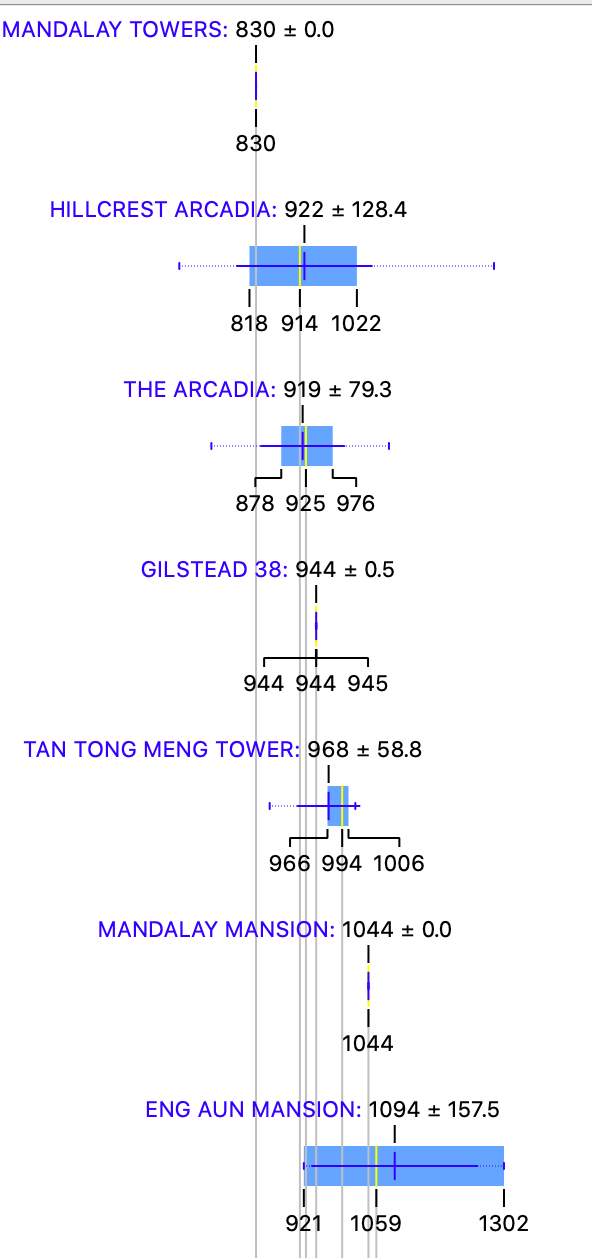
How do the private properties in D11 generally fare? Using box plots, here are the details for each of the properties in D11.

More box plots of other condominiums in this district (together with all the other districts) could be unlocked when you become a patron (https://www.patreon.com/datascienceinvestor)
To help you better understand the data, I will use Thomson Vale as an example here.

From the diagram, you can see that
Average price- $1262psf
Median price- $1262 psf
Price at 25th percentile- $1190 psf
Price at 75th percentile- $1334 psf
Box plot is generally a good way to present the data. In this case, you can easily see the average price, median price, price at 25th percentile and price at 75th percentile from the plots. You could also easily tell at one glance how wide the spread of prices are for any of the condominium projects.
The metric used here is $psf as it is a common indicator to reflect property prices.
The most expensive condominium in D11 is Pullman Residences Newton (former Dunearn Gardens) with an average price of $2988 psf while the most affordable condominium/apartment in D11 is Mandalay Towers with an average price of $830 psf. Pullman Residences Newton is a freehold condominium which is expected to TOP in 2023. Located right opposite Newton MRT station, residents can expect themselves to be able to reach Orchard Road or CBD area within minutes. Price wise, it seems to be on the high side as you have Newton One located just beside it but selling at a much cheaper average price of $1950 psf.
Mandalay Towers is a freehold condominium which was completed in 1970 (50 years ago!) Thankfully it's a freehold hence there is still some price protection here. Being located a good 12 minutes walk away from Novena MRT station (the nearest MRT Station), I will say that its location is less than ideal as compared to most other private properties in D11.
Let's take a look at the various scatter plots to have a better insight of how the property prices perform across 1466 transactions in the past 3 years.

First, a scatter plot of the $psf against date.
In scatter plot, we could derive r coefficient, which is used to explain the strength of the linear relationship between 2 variables. Since we are using $psf and date as the variables, r coefficient allows us to better understand how the $psf changes with time. To some extent, if the r coefficient is high, we could roughly assume that the $psf increases positively with time.
The r coefficient (or much simply/loosely put, the gradient for the line of best fit) in the scatter plot above is 0.14, which shows very modest increment of $psf over the past 3 years. Such a value is probably above the average as compared to many other districts I have analysed thus far.
So, which projects perform remarkably well comparatively amid the general decline in the district in the past 3 years?

The plot above shows a myriad of lines of best fit from various different projects in D11.
Two of the top performing projects from the graph above are Park Infinia at Wee Nam and Hillcrest Arcadia. Park Infinia at Wee Nam is a freehold condominium project which was completed in 2008. Its location is not the most ideal as you will still need 9 minutes to walk to Newton MRT station (the nearest MRT station). In fact, there are slightly more affordable freehold projects like MIRO and The Lincoln Residences which are located slightly nearer to Newton MRT station. Yet, their $psf performances in the past 3 years pales in comparison to Park Infinia at Wee Nam. Readers who know why, please drop me a message.
Hillcrest Arcadia is a 99 year leasehold project which was completed in 1980 (quite some time ago). Located within less than 700m to Raffles Girls' Primary School, Hillcrest Arcadia looks to be a potential project for prospective parents. However, it will take you 15 minutes to walk to Tan Kah Kee MRT station (the nearest MRT station).
I'm actually quite pleasantly surprised by the low price point Hillcrest Arcadia has ($922 psf). This is perhaps one of the more affordable price points for private properties in D11. However, I also notice that it is a 99 year leasehold project hence the prices will likely not hold up too well in the near future as this project is already "40 years old". If you like the location where Hillcrest Arcadia is, you might like to consider Watten Hill or Watten Estate Condominium. They are slightly more expensive with an average price of $1100-1300 psf but they are of freehold status.
Next, how do freehold perform against leasehold during this 3 years period?

I have only included freehold transactions in this plot and you could see that the r coefficient of 0.15 is very similar compared to the r coefficient of 0.14 for the scatter plot with all transactions. Hence, I will think that there isn't too much of a difference in terms of increment of $psf between leasehold and freehold condominiums/apartments in D11 in the past 3 years.
How about apartments of various sizes? How do they perform against each other?


Apartments with sizes between 500 and 1000 sqft (typically the 2 bedders) show the highest r coefficient of 0.31 compared to apartments of other sizes. This meant that apartments of such sizes have the best growth in $psf in the past 3 years. Comparatively, apartments of sizes less than 500 sqft show a negative r coefficient. This isn't a good sign as it represents that $psf for apartments of such sizes is on a downward trend.
For my regular readers, you will know that this is where I will briefly talk about the various different machine learning models and attempt to apply my machine learning model to determine a fair value for a certain property listing on PropertyGuru. If you have not read about this before, you may just refer to any of the district analysis I have done in my previous articles and you should be able to find it.
For the benefit of the regular readers, I'm going to remove the chunk of text and go straight to the analysis. Like mentioned in the earlier articles, I will talk more about these machine learning models and will probably do so when I have finished analyzing all 28 districts in Singapore.
Running through all 1466 transactions through several machine learning models, I eventually achieve a model which provides me with suitable evaluation results. (MAE of 166550, RMSE of 290456 and R2 of 0.961).
I then now try to put this machine learning model to practice and use it to determine what should be a reasonable price for the following property.
Project: Park Infinia At Wee Nam
Area: 1442 sqft
Floor level: Low Floor (assume to be 01 to 05)
Running through the machine learning model which I have created, the price I have obtained is $2,964,878 which is not too different from the asking price of $3,000,000. This asking price of $3,000,000 translates to a $psf of $2080 which is slightly less than the 75th percentile pricing ($2118 psf) based on the transactions pertaining to Park Infinia At Wee Nam in the past 3 years. This might then suggests that the asking price is reasonable and well within the acceptable range. More investigation will also be needed to look at other factors (such as flat orientation and renovation status etc) beyond the parameters such as floor level, area size and project name.
Now, with these data in mind, go be a data science investor! #datascienceinvestor

Refer here for analysis on the other districts!
Psst.. If you like what you read, please scroll down and subscribe for regular updates!


Comments