Buying a private property in District 10
- datascienceinvestor

- Feb 29, 2020
- 6 min read
Updated: May 17, 2020

(Photo credit: Wikipedia)
Date of Analysis: 16 February 2020
Period of data: Feb 2017 to Feb 2020
Number of transactions analyzed: 3481
(transaction data extracted from URA website)
This is part of an ongoing series "Singapore Private Condominium Guide". Please refer to the link for analysis on the other districts.
District 10 is one of the prime districts within the CCR (Core Central Region) of Singapore. Similar to District 9 which I have covered previously, District 10 is one of the upmarket districts in Singapore. It comprises of few neighbourhoods such as Bukit Timah, Holland and Tanglin. Some of the private properties in this region are The Legend, Madison Residences and D'Leedon etc. Recent new properties in the area are plenty as always seen in the CCR. Some of the examples are Boulevard 88 (which the CDL boss chairman's bought 2 units of), Forth Avenue Residences, Juniper Hill, 3 Cuscaden, Royalgreen and many many more. In fact, there are transactions for 287 different condominium in District 10 in the last 3 years alone! This goes to show the sheer number of private properties in such CCR districts typically dwarf the number in RCR and OCR districts.
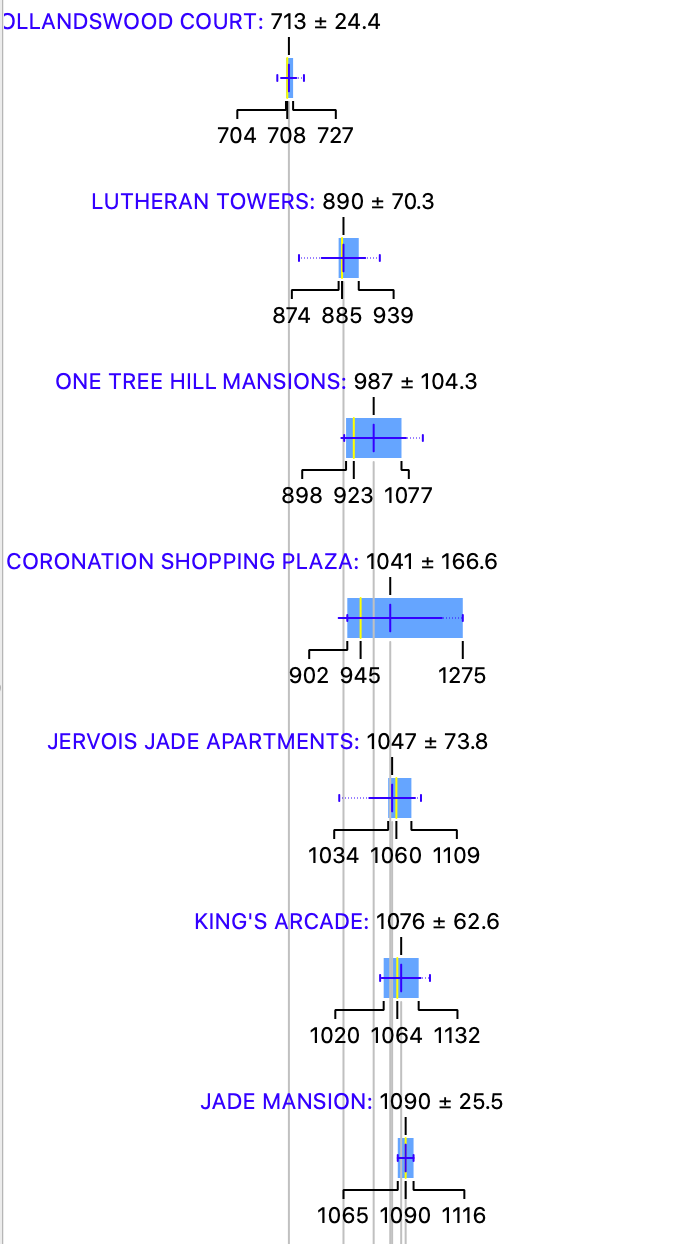
How do the private properties in D10 generally fare? Using box plots, here are the details for each of the properties in D10. (Beware there is quite a number so you might take some time to scroll through all of them)

More box plots of other condominiums in this district (together with all the other districts) could be unlocked when you become a patron (https://www.patreon.com/datascienceinvestor)
To help you better understand the data, I will use Ardmore Three as an example here. From the diagram, you can see that

Average price- $3642 psf
Median price- $3548 psf
Price at 25th percentile- $3361 psf
Price at 75th percentile- $4174 psf
I personally think that box plot is a good way to present the data. In this case, you can easily see the average price, median price, price at 25th percentile and price at 75th percentile from the plots. You could also tell at one glance how wide the spread of prices are for any of the condominium projects. Pretty neat, I will think.
The metric used here is $psf as it is a common indicator to reflect property prices.
The most expensive condominium in D10 is Sculptura Ardmore with an average price of $4429 psf! If you have not seen how Sculptura Ardmore looks like, I strongly recommend you to take a look here. There is currently one listing in PropertyGuru for this condominium project and guess what? It comes with a huge price tag of $42 millions!!! Estimated monthly mortgage is $122,832!! That's more than what most people earn in a year!
The most affordable condominium in D10 is Hollandswood Court with an average price of $713 psf. This is a 99 year leasehold project which TOP in 1978. It doesn't has too many units (just 27 units up for grabs). Location wise, it's more than 1 km from both the Holland Village MRT station and Farrer Road MRT station. But hey, $713 psf for a place in D10- what more could you ask for?
Now, let's take a look at the various scatter plots to have a better insight of how the property prices perform across 3481 transactions in the past 3 years.

First, a scatter plot of the $psf against date.
In scatter plot, we could derive r coefficient, which is used to explain the strength of the linear relationship between 2 variables. Since we are using $psf and date as the variables, r coefficient allows us to better understand how the $psf changes with time. To some extent, if the r coefficient is high, we could roughly assume that the $psf increases positively with time. The r coefficient (or much simply/loosely put, the gradient for the line of best fit) in the scatter plot above is 0.32. This indicates that the $psf is enjoying a healthy increment in the past 3 years. This is also a value which is higher than the r coefficients for most of the other districts I have analyzed so far, including D9.
From this line of best fit, you could also better understand if you are "over-paying" for your property purchase (eg. if you property is above the line of best fit). Taking a quick glance at the scatter plot, your transaction will be on the high side if you are paying more than $2200 psf in Oct 2018 (not too different from D9). Of course, there could be many factors such as location, tenure etc that could influence your buying price. This is still a general assumption.
So, which projects perform remarkably well comparatively in the past 3 years?

The plot above shows a myriad of lines of best fit from various different projects in D10.
While most people might have the misconception that buying a condominium in CCR is a "sure win". It might not necessarily be so as you could there is a good mixture of properties with $psf increasing and properties with $psf even decreasing over the past 3 years. Sure, condominium in CCR generally performs well as the economy of Singapore improves. But this is a generalisation and does not apply to every project.
2 of the top performing projects from the graph above are Gramercy Park and D'Leedon. Gramercy Park is a freehold development which was completed in 2016. In fact, it's the only freehold development in the whole of Grange road. This might have thus helps in its price appreciation over the years. It's not near to any MRT station but I reckon that if you could afford a condominium like Gramercy Park, you probably will not need a place that is near to a MRT station.
D'Leedon (former Farrer court) is a 99 year leasehold project which was completed in 2014. It's kinda a mega project as it has 1715 units in total (projects of such scale is rare in CCR). Location wise, it's just 6 minutes walk from the Farrer Road MRT station which makes it very accessible.
Next, how do freehold perform against leasehold during this 3 years period?

I have only included freehold transactions in this plot and you could see that the r coefficient of 0.30 is not too different from the r coefficient of 0.32 for the scatter plot with all transactions. This means that the freehold properties in D10 perform quite similarly to the leasehold properties in D10 in terms of $psf over the past 3 years. Such performance is similar to D9. This is quite understandable as most condominiums in CCR are freehold, hence I wont' expect too big of a difference as compared to the general trend in the district.
Also, how about apartments of various sizes? How do they perform against each other?


Again, just like D9, apartments with size less than 500 sqft perform the best in terms of $psf increment over the past 3 years. This shows that investing in a one bedder or studio apartment in D9 or D10 (generally CCR) is a worthy investment.
What you have seen above are largely data insights that we have derive using the various data science tools. But, what if we could actually use these insights to build machine learning model to attempt to predict the prices of the properties in D10 and understand if the prices the seller is asking for is reasonable? How could we do that?
We could try various different machine learning models to attempt to do so. Some examples of such machine learning models we could use are random forest and linear regression. They are methods which we could generally use to apply regression techniques to attempt to construct a linear relationship between price and various other variables (in this case, it will be project name, date of sales, size of flat etc). What we ultimately try to construct is a predictive model which allows us to have the highest confidence in prediction by attempting to reducing as much prediction errors as possible (think about Mean Absolute Error and Root Mean Squared Error)
If you are already feeling confused at this point of time, don't be as these information are highly technical in nature. You may read up more about them if you want to. Otherwise, I believe the information above in the box plots and scatter plots are more than enough for you to better understand the property prices in D10. I will also attempt to explain or illustrate more of this in a separate post in the future.
Running through all 3481 transactions through several machine learning models, I eventually achieve a model which provides me with suitable evaluation results (MAE of 58126, RMSE of 237338 and R2 of 0.988).
I then now try to put this machine learning model to practice and use it to determine what should be a reasonable price for the following property.
Project: Regency Park
Area: 2250 sqft
Floor level: Low (i'm going to assume it is from level 01 to 05)
Running through the machine learning model which I have created, the price I have obtained is $4,702,980 which is more than the asking price of $4,500,000. This might then suggest that the asking price is reasonable and worth looking at. But of course, more investigation will also be needed to look at other factors beyond these parameters.
Of course, the above example is just a glimpse of what is achievable as you could actually use it to determine a lot more property prices in the region. In the future, I will also consider uploading this machine learning model online so you could actually use it to determine/predict property prices based on this model. But that's a story for another day.
Now, with these data in mind, go be a data science investor!

Refer here for analysis on the other districts!
Psst.. If you like what you read, please scroll down and subscribe for regular updates!


Comments