Buying a private property in District 1
- datascienceinvestor

- Apr 22, 2020
- 5 min read
Updated: May 17, 2020

(Photo credit: Wikipedia)
Date of Analysis: 6 April 2020
Period of data: Apr 2017 to Mar 2020
Number of transactions analyzed: 705
(transaction data extracted from URA website)
This is part of an ongoing series "Singapore Private Condominium Guide". Please refer to the link for analysis on the other districts.
District 1 is one of the districts within the CCR (Core Central Region) of Singapore. It comprises of few areas such as Raffles Place, Boat Quay and Chinatown. Some of the private properties in this region are V on Shenton, Emerald Garden and The Sail @ Marina Bay etc. There are not many new launches in this district, with the most recent ones being Marina One Residences and V on Shenton. As D1 is a business district, there aren't many residential apartments in this district. In fact, the number of transactions in this district for the past 3 years is just a mere 705. This is even lesser than the number of transactions in D28 (Yio Chu Kang) for the same time period.
How do the private properties in D1 generally fare? Using box plots, here are the details for each of the properties in D1.


More box plots of other condominiums in this district (together with all the other districts) could be unlocked when you become a patron (https://www.patreon.com/datascienceinvestor)
To help you better understand the data, I will use Marina One Residences as an example here.

From the diagram, you can see that
Average price- $2460psf
Median price- $2411 psf
Price at 25th percentile- $2269 psf
Price at 75th percentile- $2573 psf
Box plot is generally a good way to present the data. In this case, you can easily see the average price, median price, price at 25th percentile and price at 75th percentile from the plots. You could also easily tell at one glance how wide the spread of prices are for any of the condominium projects.
The metric used here is $psf as it is a common indicator to reflect property prices.
The most expensive condominium in D1 is Robinson Suites with an average price of $2518 psf while the most affordable condominium/apartment in D1 is People Park Complex with an average price of $960 psf. Robinson Suites is a freehold condominium which was completed in 2016. It has an insanely good location with all 3 MRT stations(Telok Ayer, Downtown, Raffles Place) a mere 5 minutes walk away. Such location with its small apartment sizes make it an ideal place for any single expat who's working in the CBD area.
People Park Complex is a 99 year leasehold apartment which was completed in 1973. As most of us could have known, the location of this apartment is just a stone throw away from Chinatown MRT station (2 minutes walk). The building is also iconic as I'm sure almost everyone who has been in Chinatown would have noticed it. While the building might be old, residents of People Park Complex might just be living in one of the best mixed development in Singapore with a whole range of amenities just at their doorsteps.
Let's take a look at the various scatter plots to have a better insight of how the property prices perform across 705 transactions in the past 3 years.

First, a scatter plot of the $psf against date.
In scatter plot, we could derive r coefficient, which is used to explain the strength of the linear relationship between 2 variables. Since we are using $psf and date as the variables, r coefficient allows us to better understand how the $psf changes with time. To some extent, if the r coefficient is high, we could roughly assume that the $psf increases positively with time.
The r coefficient (or much simply/loosely put, the gradient for the line of best fit) in the scatter plot above is 0.15, which goes to show a steady healthy increment of $psf over the past 3 years. Such a value is probably around the average as compared to many other districts I have analysed thus far.
So, which projects perform remarkably well comparatively amid the general decline in the district in the past 3 years?

The plot above shows a myriad of lines of best fit from various different projects in D1.
2 of the top performing projects from the graph above are Emerald Gardens and V on Shenton. Emerald Gardens is a 999 year leasehold project which was completed in 1998. Similar to Robinson Suites, it's located very near to Telok Ayer MRT station (just 4 minutes walk). Though it's a bit old, I'm sure the tenure of 999 year coupled with such a fantastic location will bound to attract investors.
V on Shenton is a 99 year leasehold project which was completed in 2017. Again, being in D1 means that the location for most of the projects in this district are likely going to be fantastic. V on Shenton is no exception with Tanjong Pagar MRT station a 5 minutes walk away. Also, V on Shenton offers upmarket living with epicurean dining being one of the options offered in this condominium.
Next, how do freehold perform against leasehold during this 3 years period?
There are only 6 transactions for freehold condominium/apartments in D1 for the past 3 years and all of them belong to Robinson Suites. Hence, I do not think it's statically meaningful to be comparing freehold against leasehold for D1.
Also, how about apartments of various sizes? How do they perform against each other?


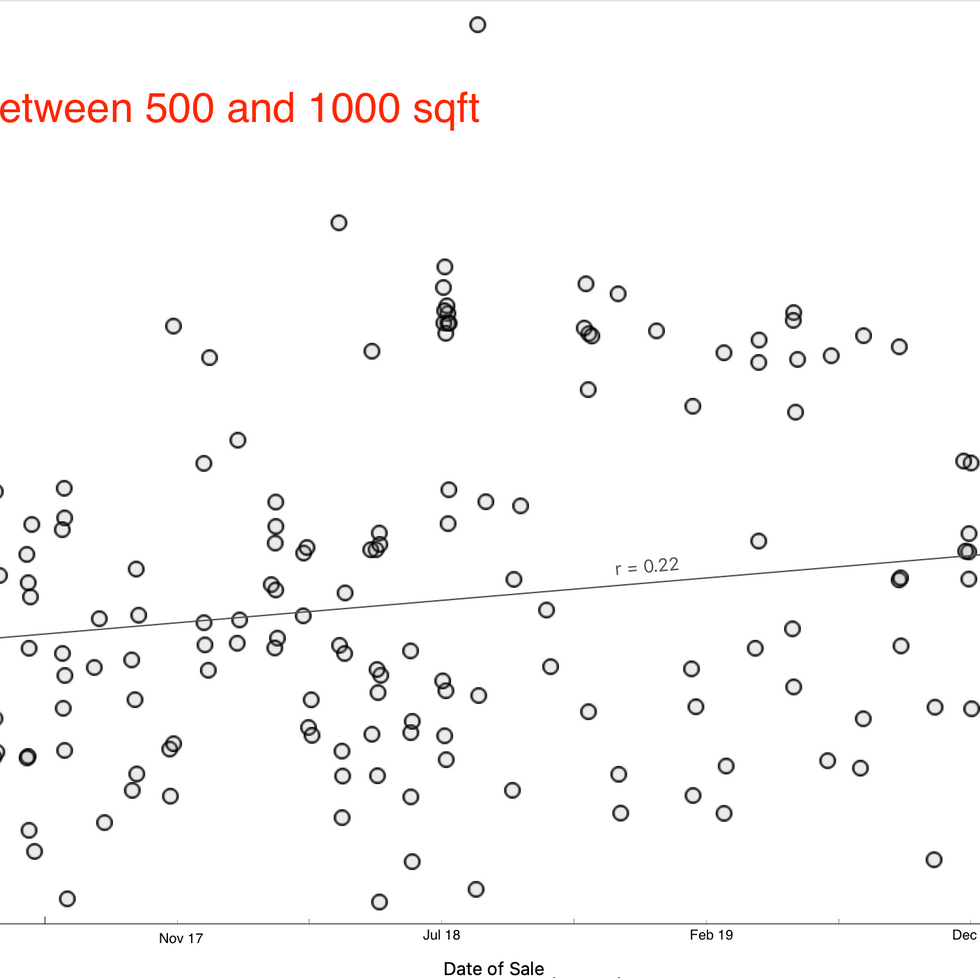


Aside from the apartments at both ends of the spectrum (less than 500 sqft, more than 1500 sqft), the apartments of other sizes (between 500 and 100 sqft, between 1000 and 1500 sqft) have a healthy increment in $psf over the past 3 years. I'm actually surprised to know that the plot for apartments with sizes less than 500 sqft has a negative r coefficient as I expect that small units in CCR should usually enjoy good price appreciation. Perhaps there are also not too many data points (pertaining to apartments with sizes less than 500 sqft) for us to arrive to a meaningful conclusion here.
For my regular readers, you will know that this is where I will briefly talk about the various different machine learning models and attempt to apply my machine learning model to determine a fair value for a certain property listing on PropertyGuru. If you have not read about this before, you may just refer to any of the district analysis I have done in my previous articles and you should be able to find it.
For the benefit of the regular readers, I'm going to remove the chunk of text and go straight to the analysis. Like mentioned in the earlier articles, I will talk more about these machine learning models and will probably do so when I have finished analyzing all 28 districts in Singapore.
Running through all 705 transactions through several machine learning models, I eventually achieve a model which provides me with suitable evaluation results. (MAE of 272841, RMSE of 385172 and R2 of 0.934).
I then now try to put this machine learning model to practice and use it to determine what should be a reasonable price for the following property.
Project: The Sail @ Marina Bay
Area: 667 sqft
Floor level: High Floor (assume to be 11 to 15)
Running through the machine learning model which I have created, the price I have obtained is $1,178,771 which is very close to the asking price of $1,180,000. This asking price of $1,180,000 translates to a $psf of $1769 which is below the 25th percentile pricing ($1793 psf) based on the transactions pertaining to The Sail @ Marina Bay in the past 3 years. Thus, this might signify a potential bargain as the asking price listed here is indeed very fair. But of course, more investigation will also be needed to look at other factors beyond these parameters.
Now, with these data in mind, go be a data science investor! #datascienceinvestor

Refer here for analysis on the other districts!
Psst.. If you like what you read, please scroll down and subscribe for regular updates!


Comments